
Pioneering Data Table Usability for Pharma
Goals
• To provide a UI that communicates data clearly for all types of reports
• To understand the various use cases of our users
• To build a design which is robust and scalable enough to accommodate different features
Methods
User research, collaboration, iterative design
Project Overview
Building on design best practises specifically for data including spacing, legibility etc. for a robust foundation
Leveraging use of screen real estate to allow effective report viewing, editing and analysing day-to-day
Delivering a clean focused UI that pairs effectively with ‘power’ usage and complex report needs
Introduction
The ability to surface data was central to our product offering at Evaluate, making my focus designing a reusable data table of critical importance.
From my research and overall UI/UX experience, I recognised how effective data table design considers factors such as information density, visual hierarchy and interaction patterns at the very least to facilitate efficient scanning, filtering and data analysis. My research at Evaluate also guided my direction to serve general user needs with a clutter-free table UI whilst still leveraging components such as overflow menus to accommodate power users.
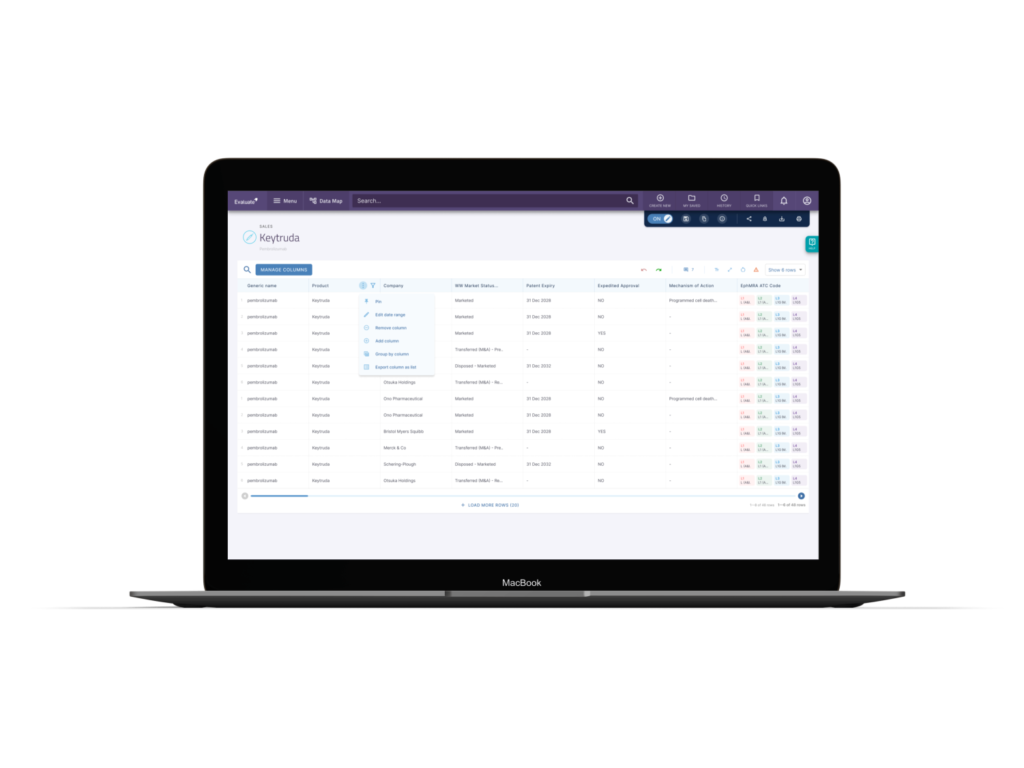
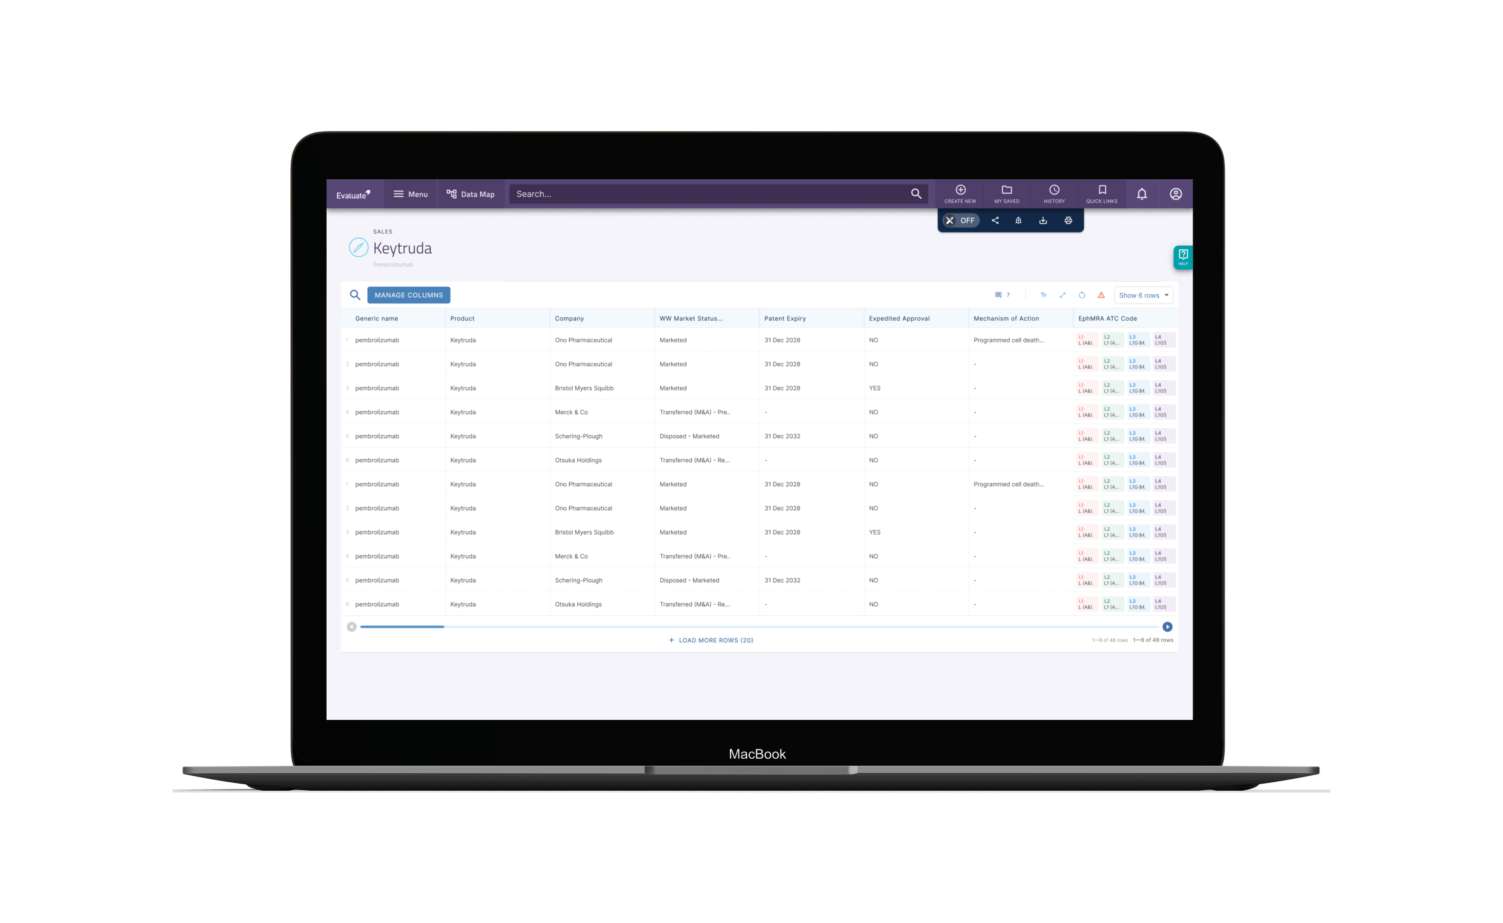
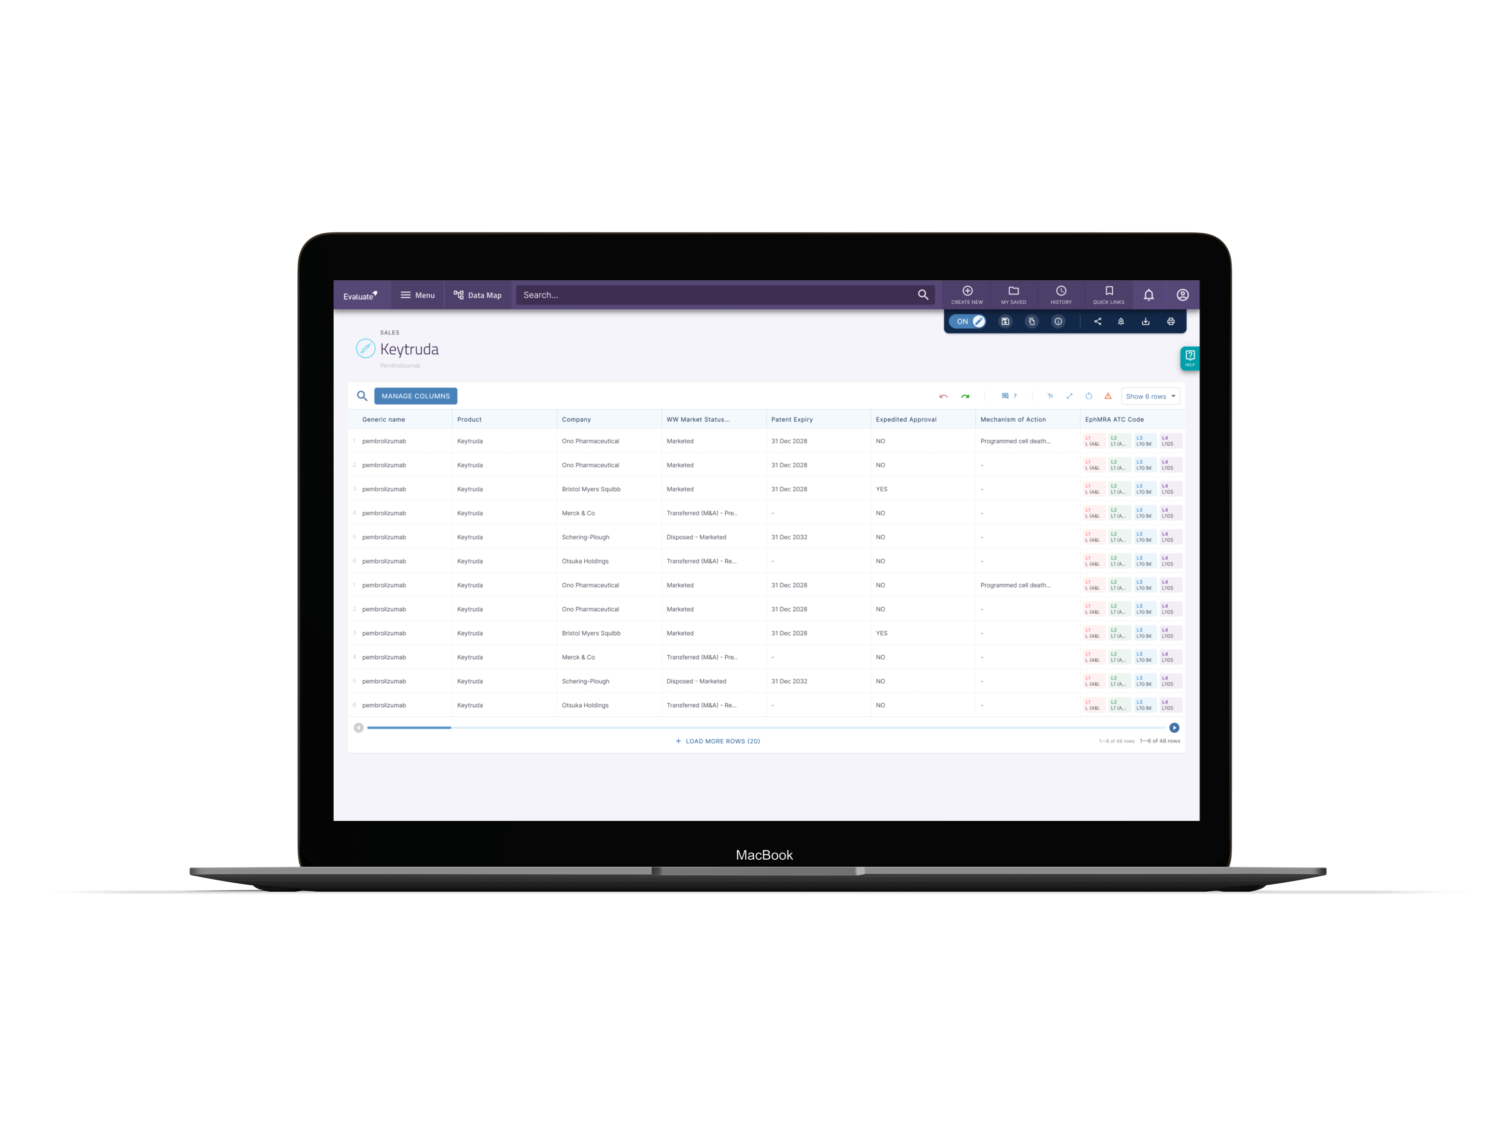
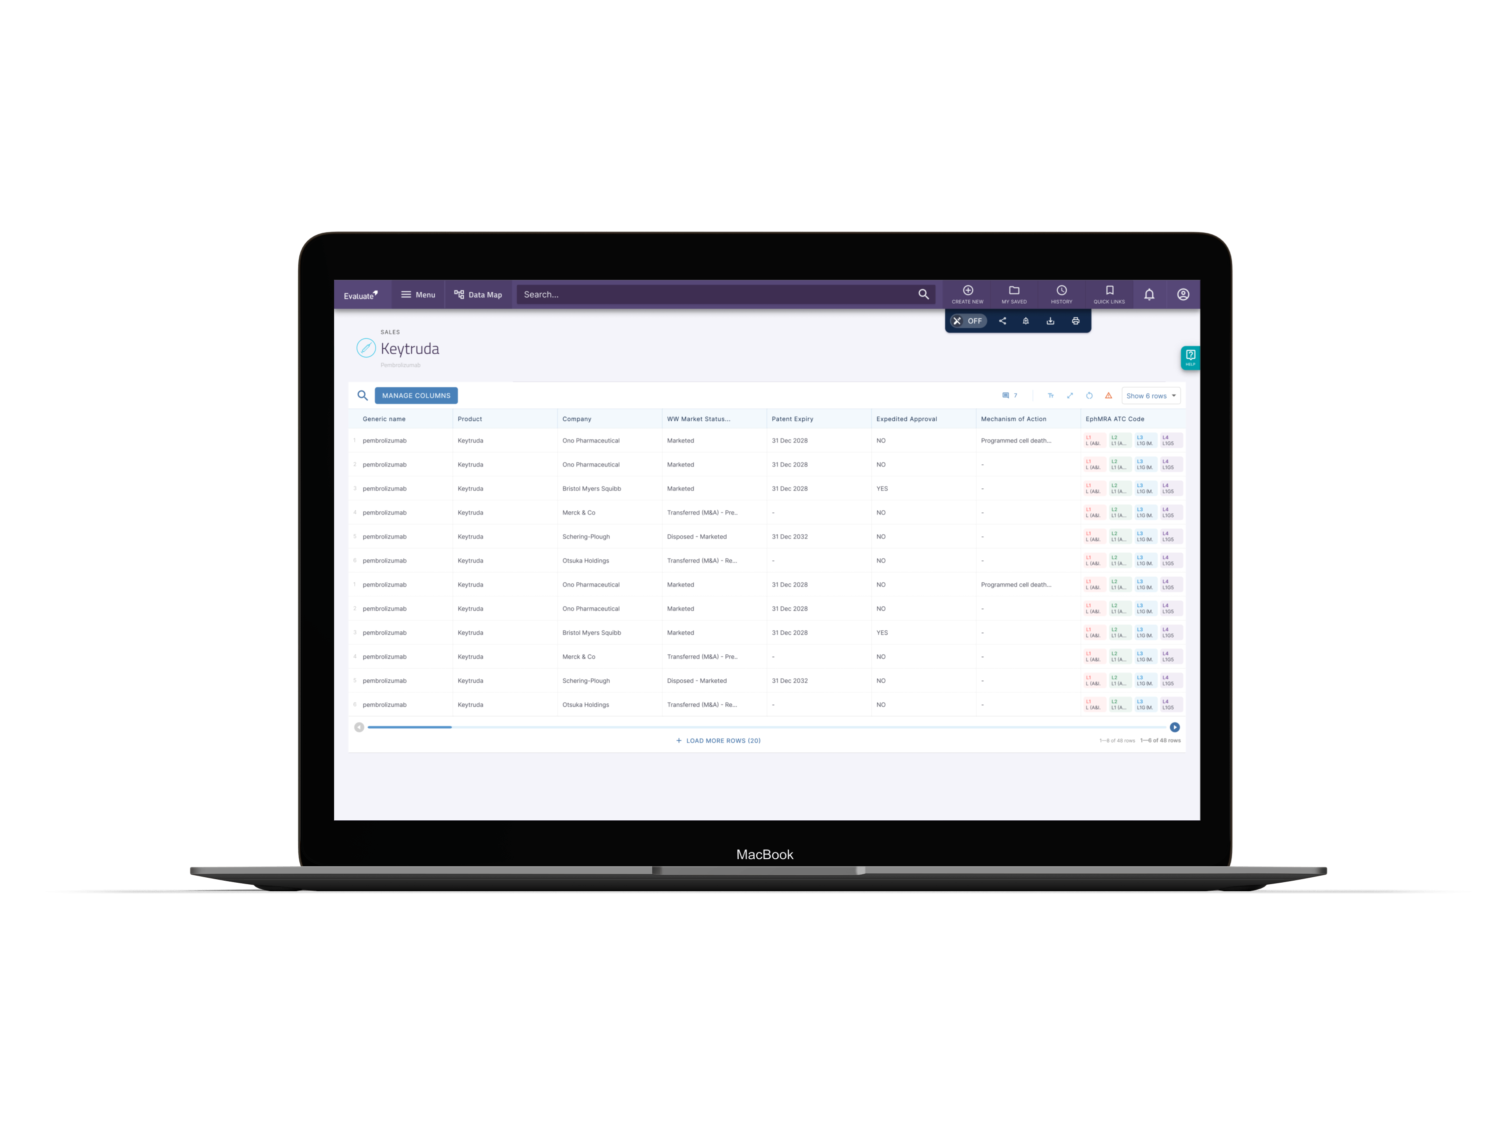
Easy to Navigate UI
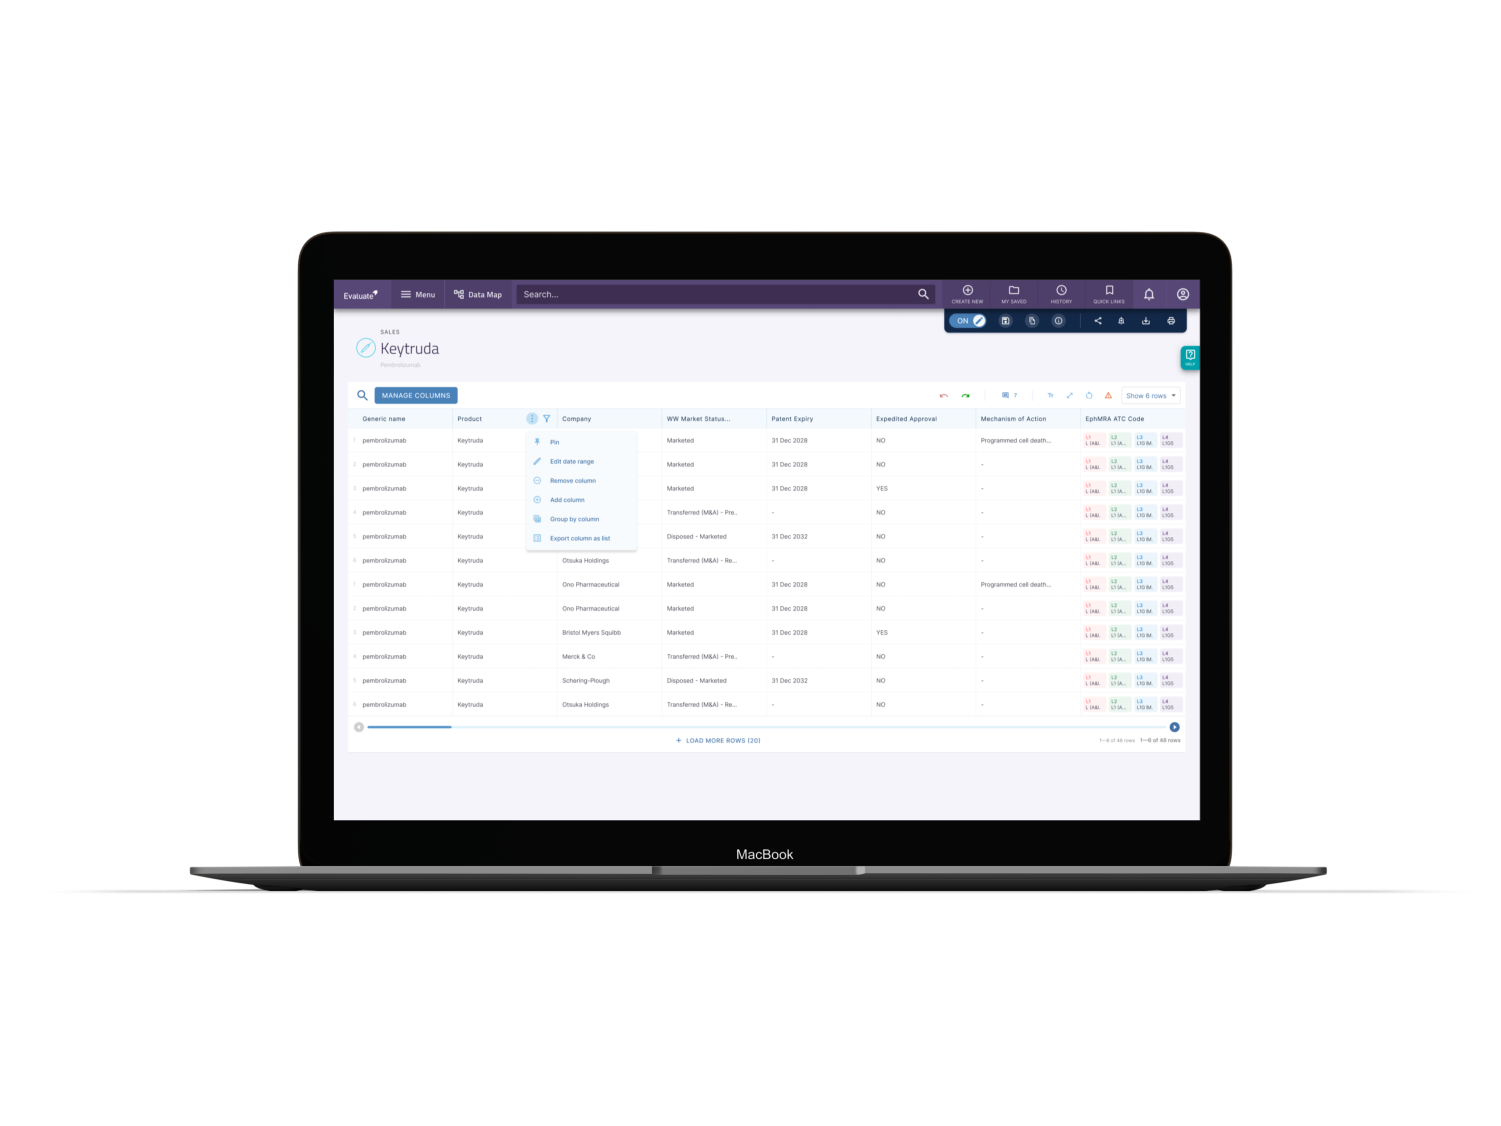
As touched on earlier, I felt overflow menus would be an ideal solution for filtering options, allowing easy access whilst still keeping the table clean and maximising space utilisation. This also reflects how design systems like Google’s Material Design handle non-essential actions, by preventing clutter in the main view. Alongside this, an integrated toolbar houses key functions like collapsed search, accessibility toggles and cell comments all within the main view balancing table visibility and intuitive ease of access.
Exploring further, though not visible here, I later introduced the concept of tabs for each table to enable easy switching between views and to allow comparative or lateral browsing.
Managing Data through Columns
Following research and observation of usage insights, I designed the ‘Manage Columns’ sheet in response to how complex it is for users to currently do just that.
Typically our users would edit columns in the table view, bearing in mind tables are often 10-15 columns long. This new format offers clarity and ease for what is essentially a query builder but with full visibility of what is currently selected, what state these are in (ordering, pinned, hidden) and what other data exists throughout the platform. Importantly, alongside ‘Search’, we also surfaced three main dropdowns housing a list of categories and sub-categories so – unlike the then current experience – users were not expected to know, remember or guess existing columns to add. This not only to eases cognitive load and choice paralysis, but also showcases the sheer breadth of data Evaluate has to offer.
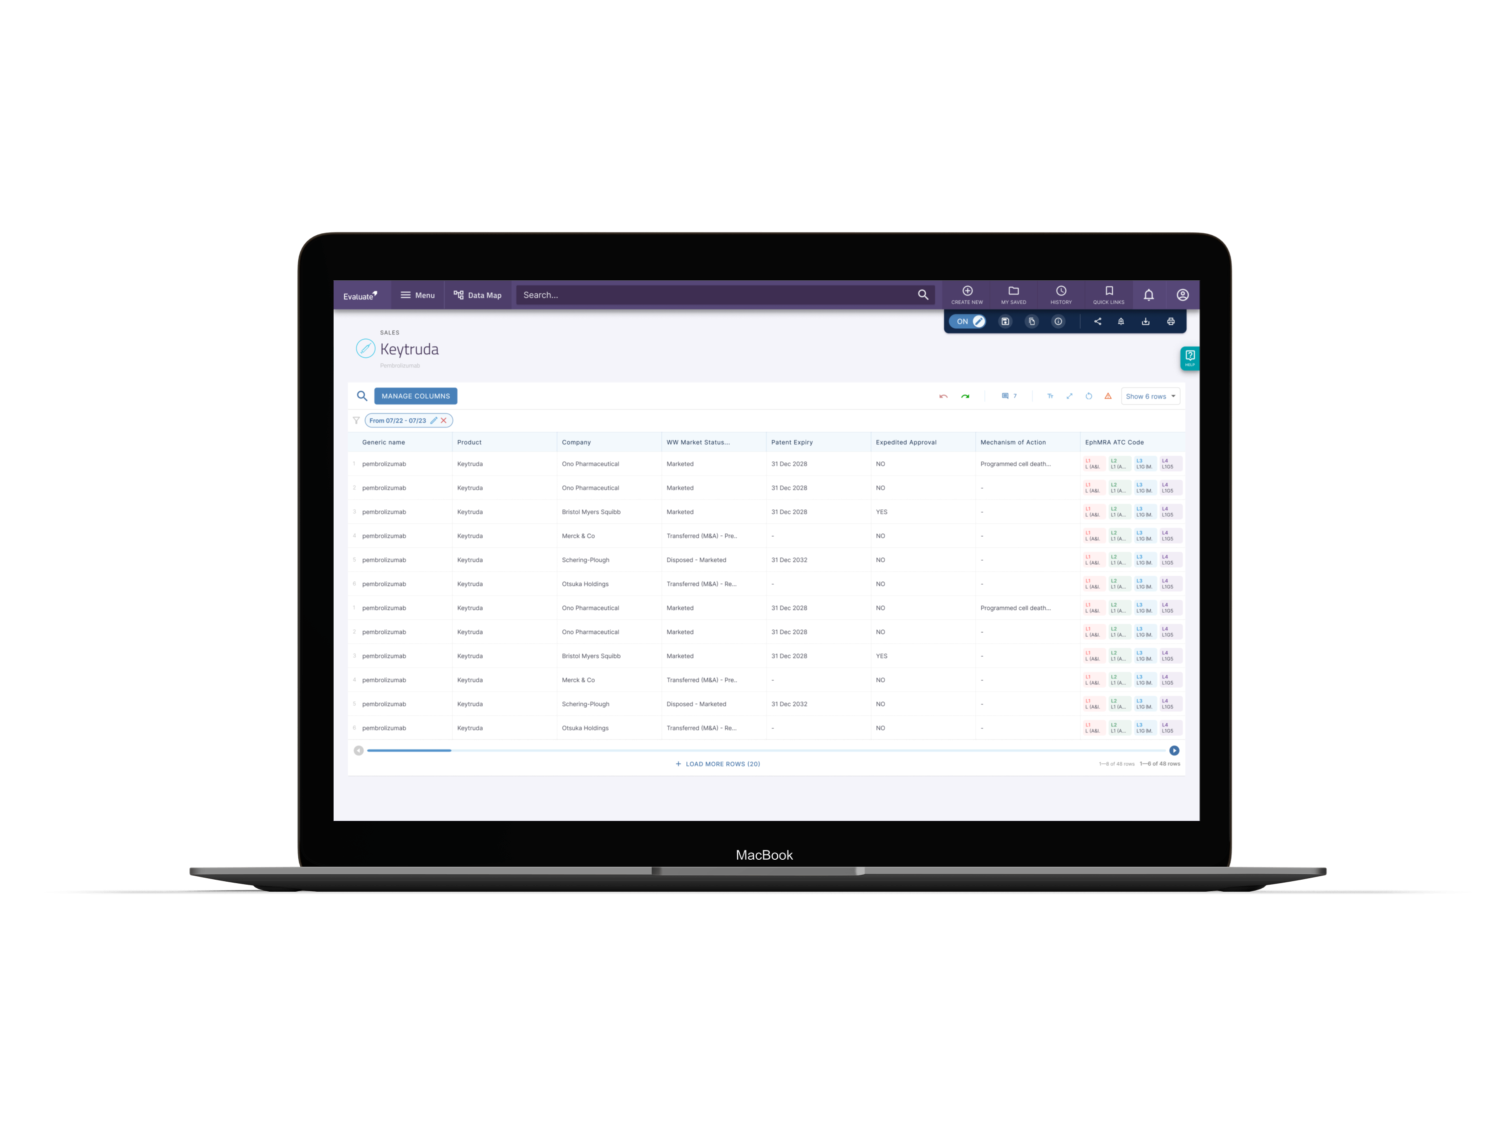
Facilitating Complex Queries
Moving forward, the table would also be able to accommodate complex queries such as sales data with time period criteria and row grouping amongst other advanced tasks (see user flow and rough design below), iteratively building and refining capabilities in ways which would suit general and power users alike.
This design build of scalable data tables required deep understanding and close collaboration across the organisation and industry around information architecture, namely domain models and data organisation, and how end users think about navigating data based on use cases and varying personas. Whilst complex and requiring the most granular attention to detail, this has been one of the most rewarding projects I’ve lead the design journey for.